 Cardiovascular Physiology Concepts, 3rd edition textbook, Published by Wolters Kluwer (2021)
 Normal and Abnormal Blood Pressure, published by Richard E. Klabunde (2013)
Mean Arterial Pressure
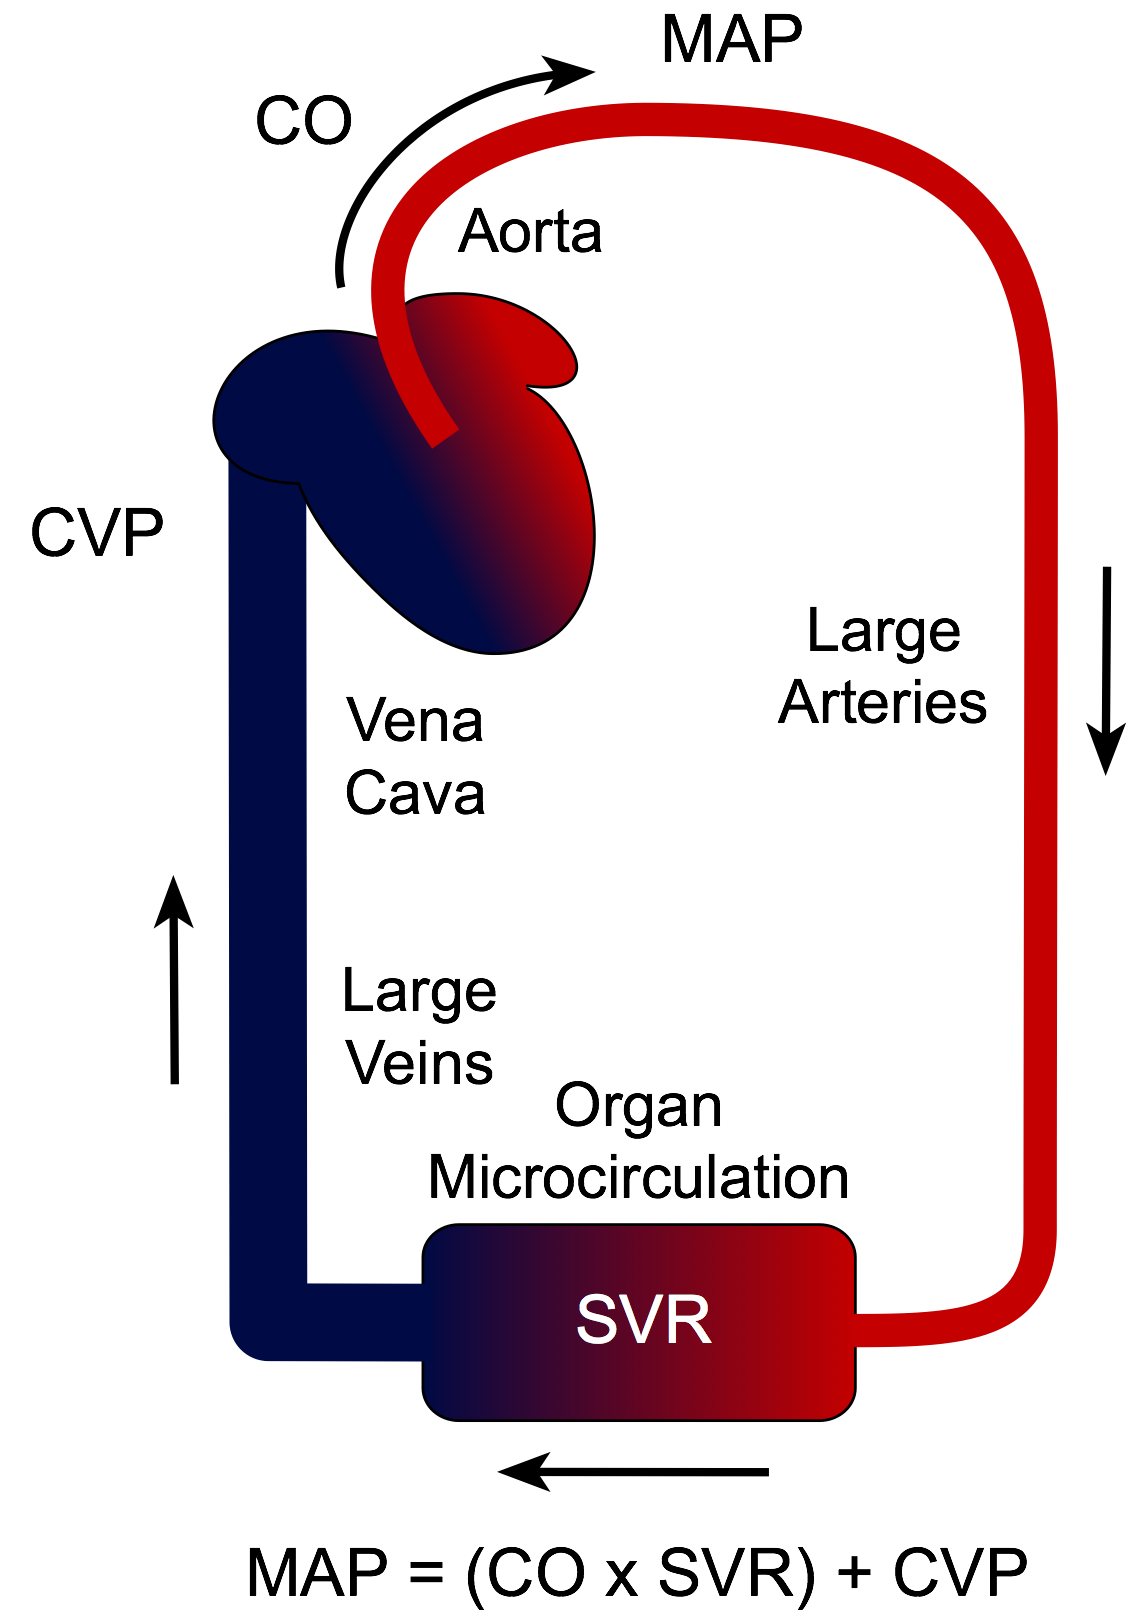 As blood is pumped out of the left ventricle into the aorta and distributing arteries, pressure is generated. The mean arterial pressure (MAP) is determined by the cardiac output (CO), systemic vascular resistance (SVR), and central venous pressure (CVP) according to the following relationship, which is based upon the hemodynamic relationship between flow, pressure, and resistance:
Eq. 1: MAP = (CO × SVR) + CVP
Because CVP is usually at or near 0 mmHg, this relationship is often simplified to:
Eq. 2: MAP ≈ CO × SVR
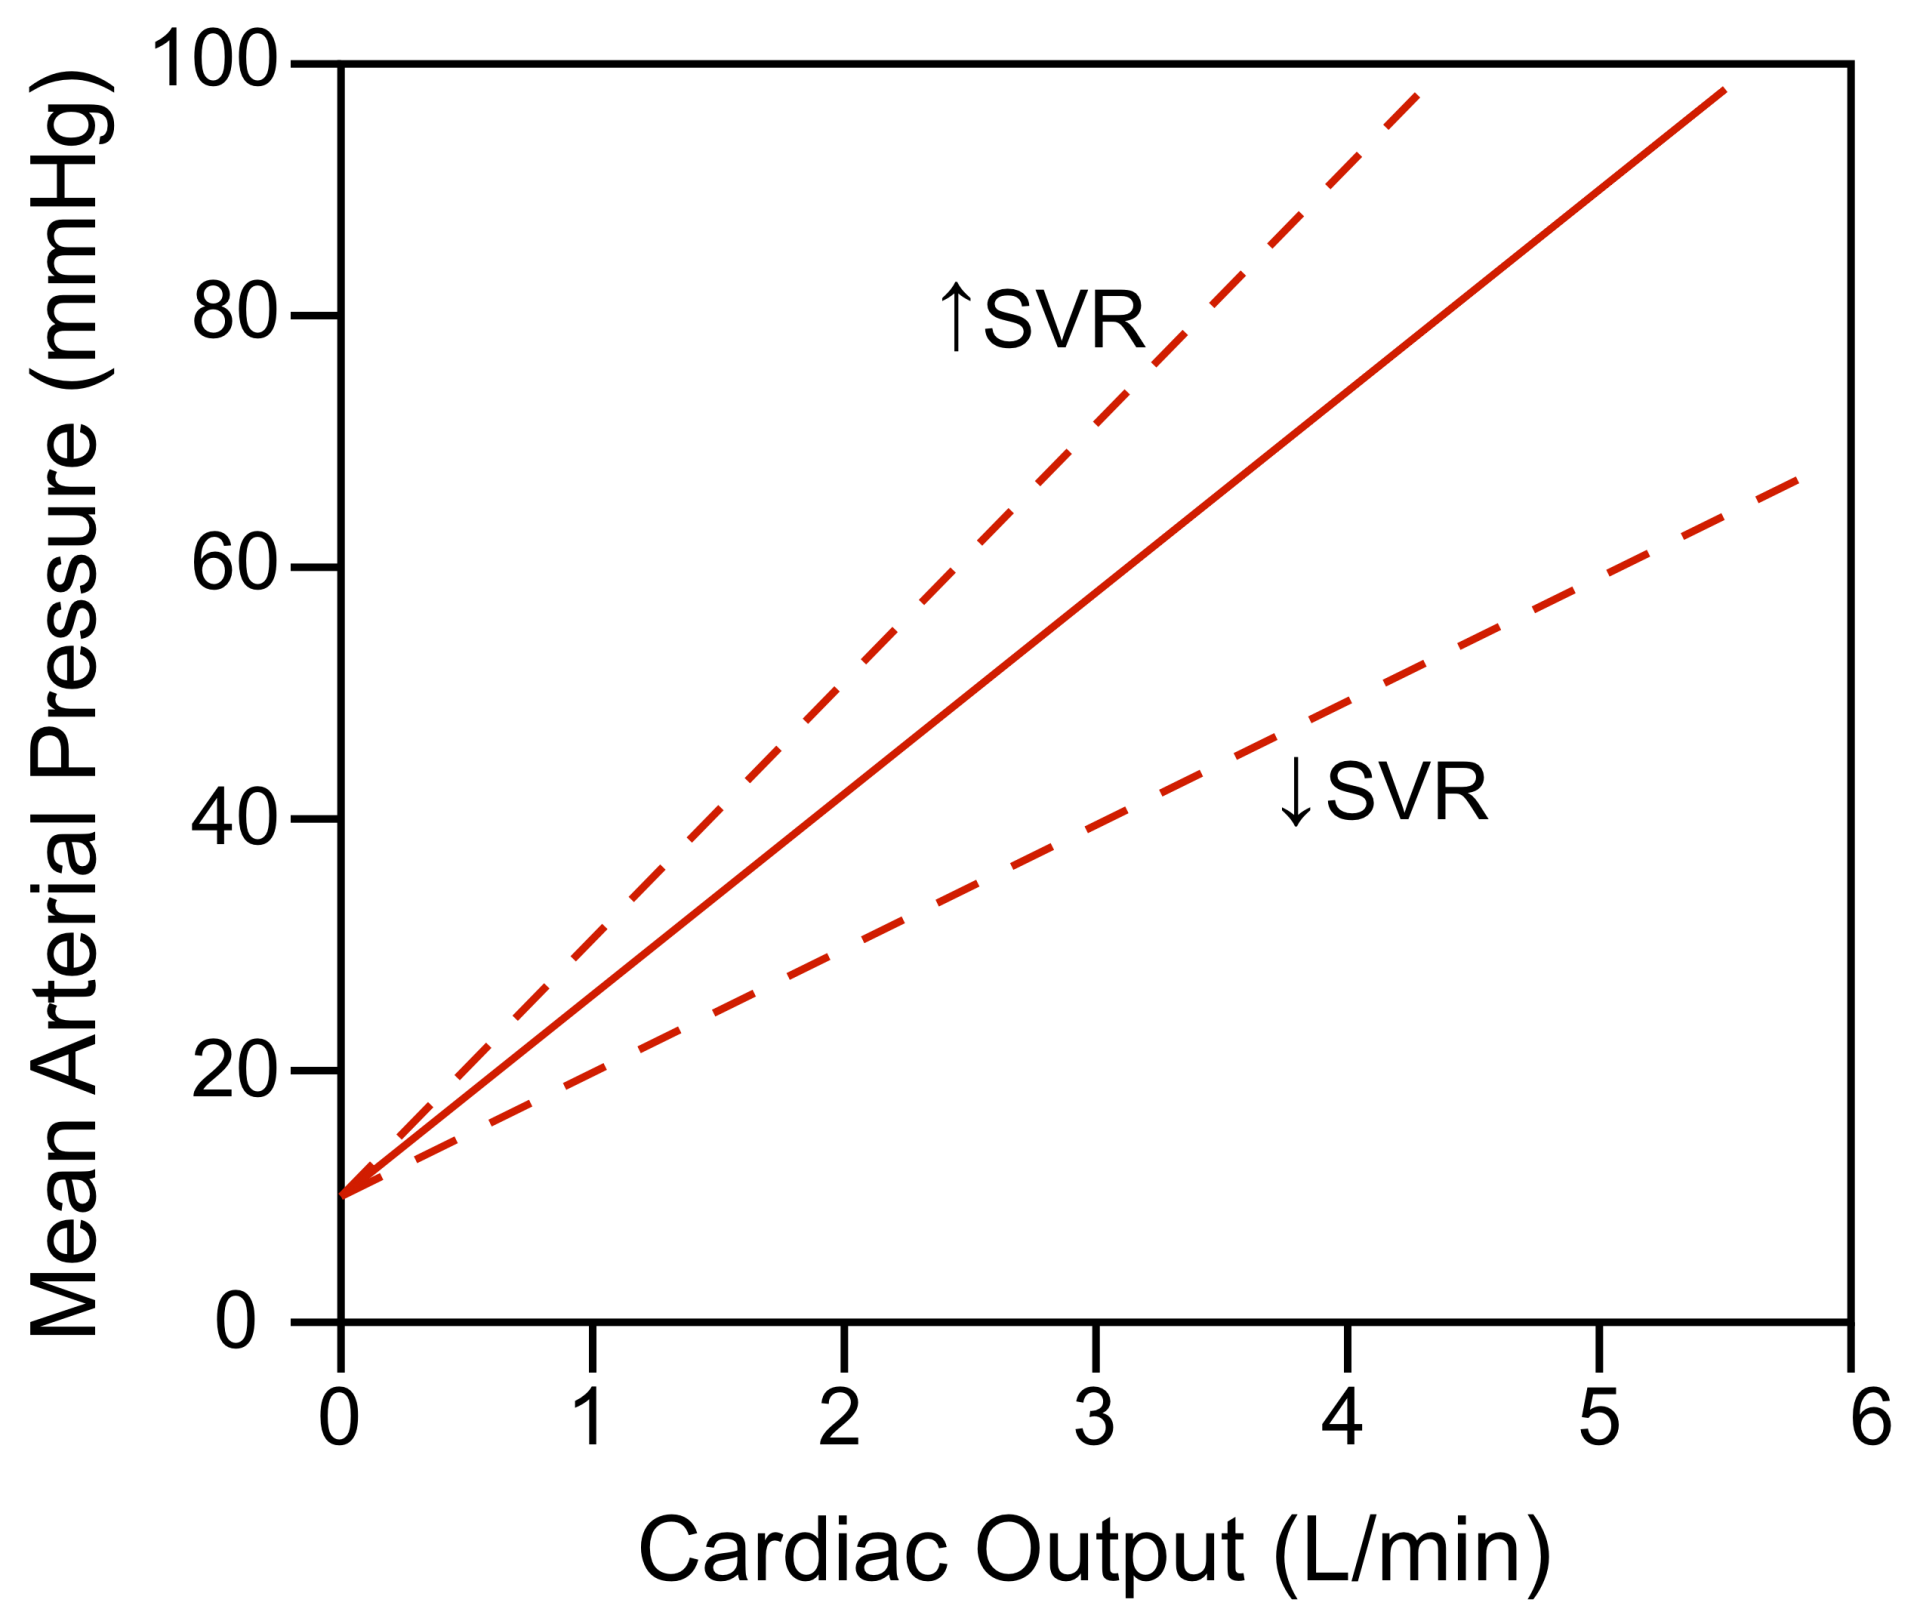 Therefore, changes in either CO or SVR will affect MAP. As shown in the graph, increasing CO increases MAP. Likewise, increasing SVR increases MAP at any given CO. If CO and SVR change reciprocally and proportionately, then MAP will not change. For example, if CO doubles and SVR decreases by one-half, MAP does not change (if CVP = 0). It is important to note that the variables found in equation 1 are all interdependent. This means that changing one variable can change each of the other variables.
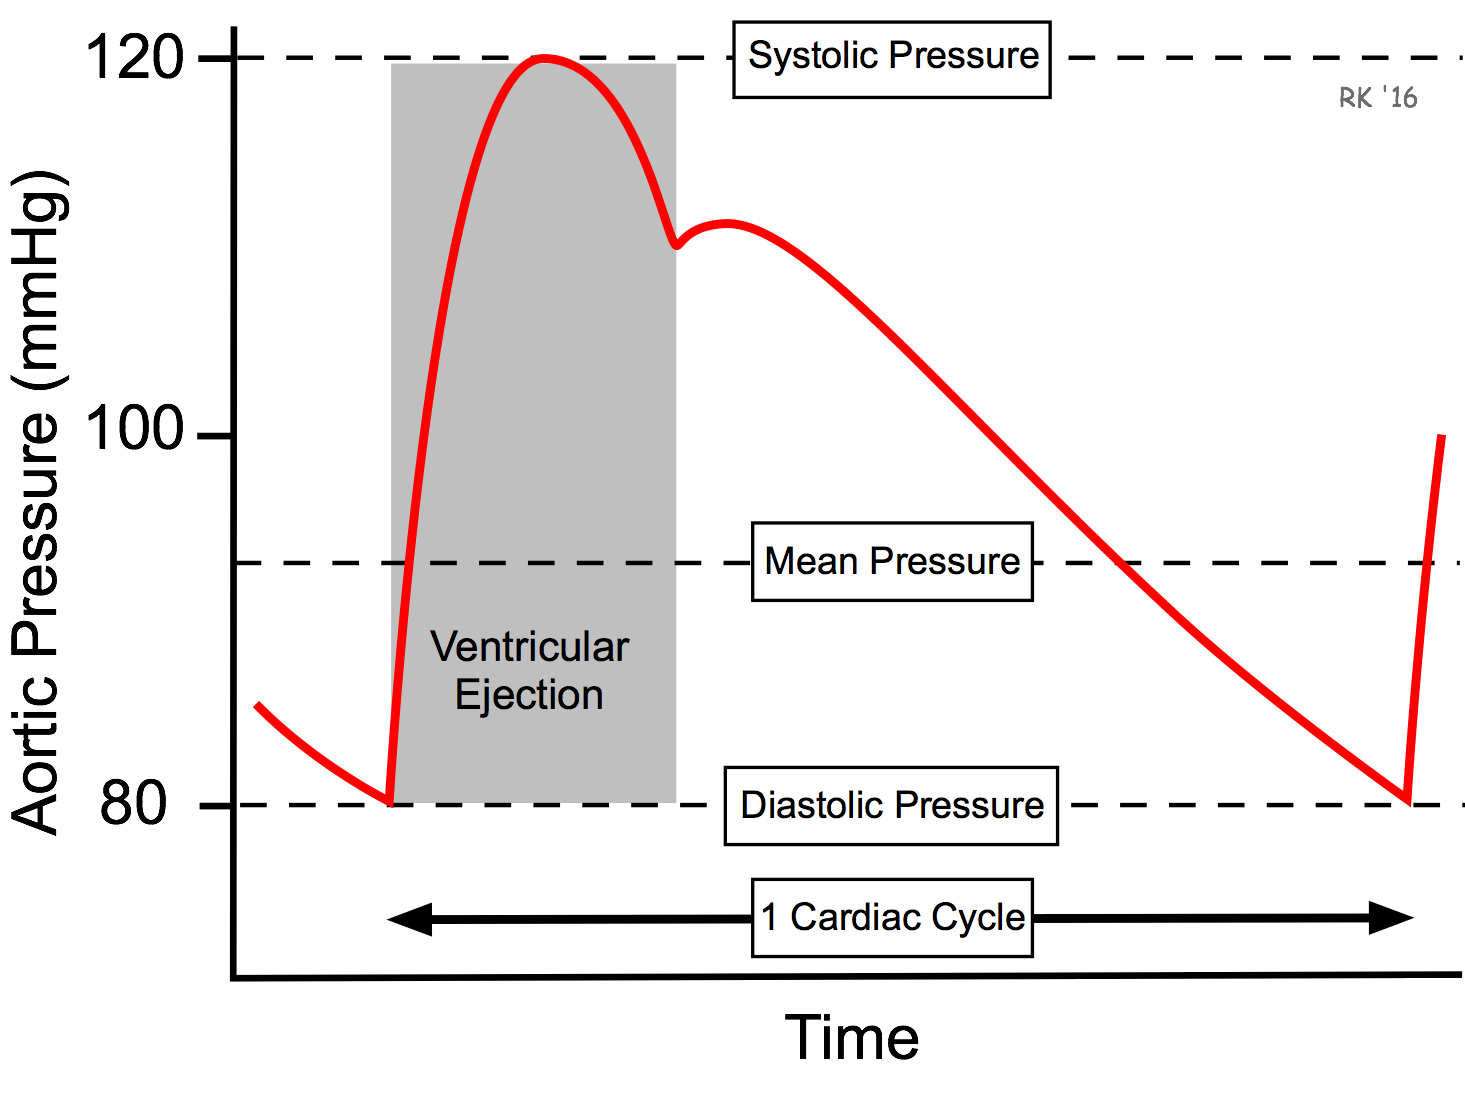
MAP is not determined by knowing the CO and SVR, but by direct or indirect measurements of arterial pressure. From the aortic pressure trace over time (see figure), the shape of the pressure trace yields a mean pressure value (geometric mean) that is less than the arithmetic average of the systolic and diastolic pressures, as shown to the right.
 At normal resting heart rates, MAP can be approximated by the following equation:

For example, if systolic pressure is 120 mmHg and diastolic pressure is 80 mmHg (as shown in the figure), then the mean arterial pressure is approximately 93 mmHg using this calculation. At high heart rates, however, MAP is closer to the arithmetic average of systolic and diastolic pressure (therefore, almost 100 mmHg in this example) because of the change in shape of the arterial pressure pulse (it becomes narrower). To determine mean arterial pressure with absolute accuracy, analog electronic circuitry or digital techniques are used. In normal clinical practice, however, systolic and diastolic pressures are measured using a sphygmomanometer. MAP is determined only when SVR needs to be calculated.
To learn what factors alter cardiac output and systemic vascular resistance, and therefore alter arterial pressure, CLICK HERE.
Revised 11/03/2023