 Cardiovascular Physiology Concepts, 3rd edition textbook, Published by Wolters Kluwer (2021)
 Normal and Abnormal Blood Pressure, published by Richard E. Klabunde (2013)
Cardiac and Systemic Vascular Function Curves
Guyton and colleagues in the 1950s and 1960s conducted extensive animal experimentation, studying the interrelationships between cardiac function and systemic vascular function. These elegant studies led to a model of these relationships that could be graphically represented by plotting both cardiac function and systemic vascular function curves on the same graph. This analysis is very helpful in understanding how changes in cardiac function affect venous pressures, and how changes in arterial and venous resistance, and blood volume affect venous pressure and cardiac output. To examine these interactions, the two component curves will first be described individually, then they will be combined to show how changes in one influence the other.
Cardiac Function Curves
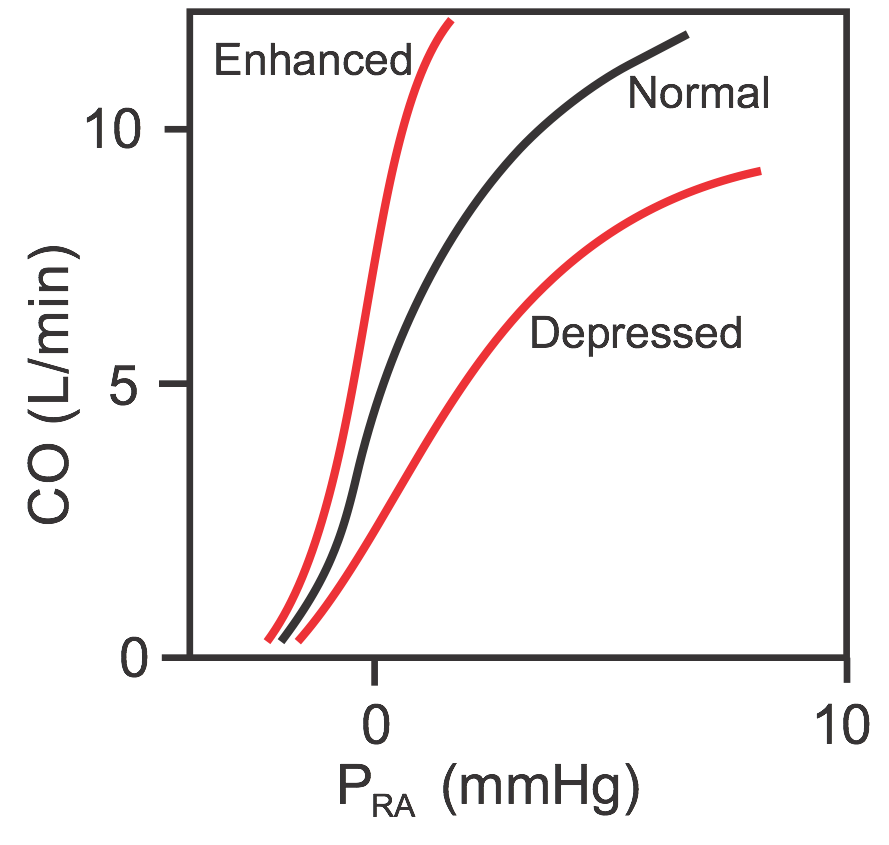 Cardiac function curves (sometimes called cardiac output curves) are essentially Frank-Starling curves, but differ in that cardiac output (CO) instead of ventricular stroke volume is plotted (see figure) against changes in venous pressure (usually right atrial pressure, PRA). Therefore, PRA is the independent variable and CO is the dependent variable; as PRA increases, CO increases. When the mean PRA is about 0 mmHg (note that PRA normally fluctuates with atrial contraction and respiration), the CO in an adult human is about 5 L/min. Because of the steepness of the cardiac function curve, small changes in PRA (just a few mmHg) can lead to large changes in CO.
Similar to Frank-Starling curves, there is no single cardiac function curve. Instead, there is a family of curves that can shift upward when cardiac performance is enhanced or shift downward when cardiac performance is depressed. Performance is enhanced by increased inotropy, increased heart rate, and reduced afterload. Performance is depressed by decreased inotropy, decreased heart rate, and increased afterload.
Systemic Vascular Function Curves
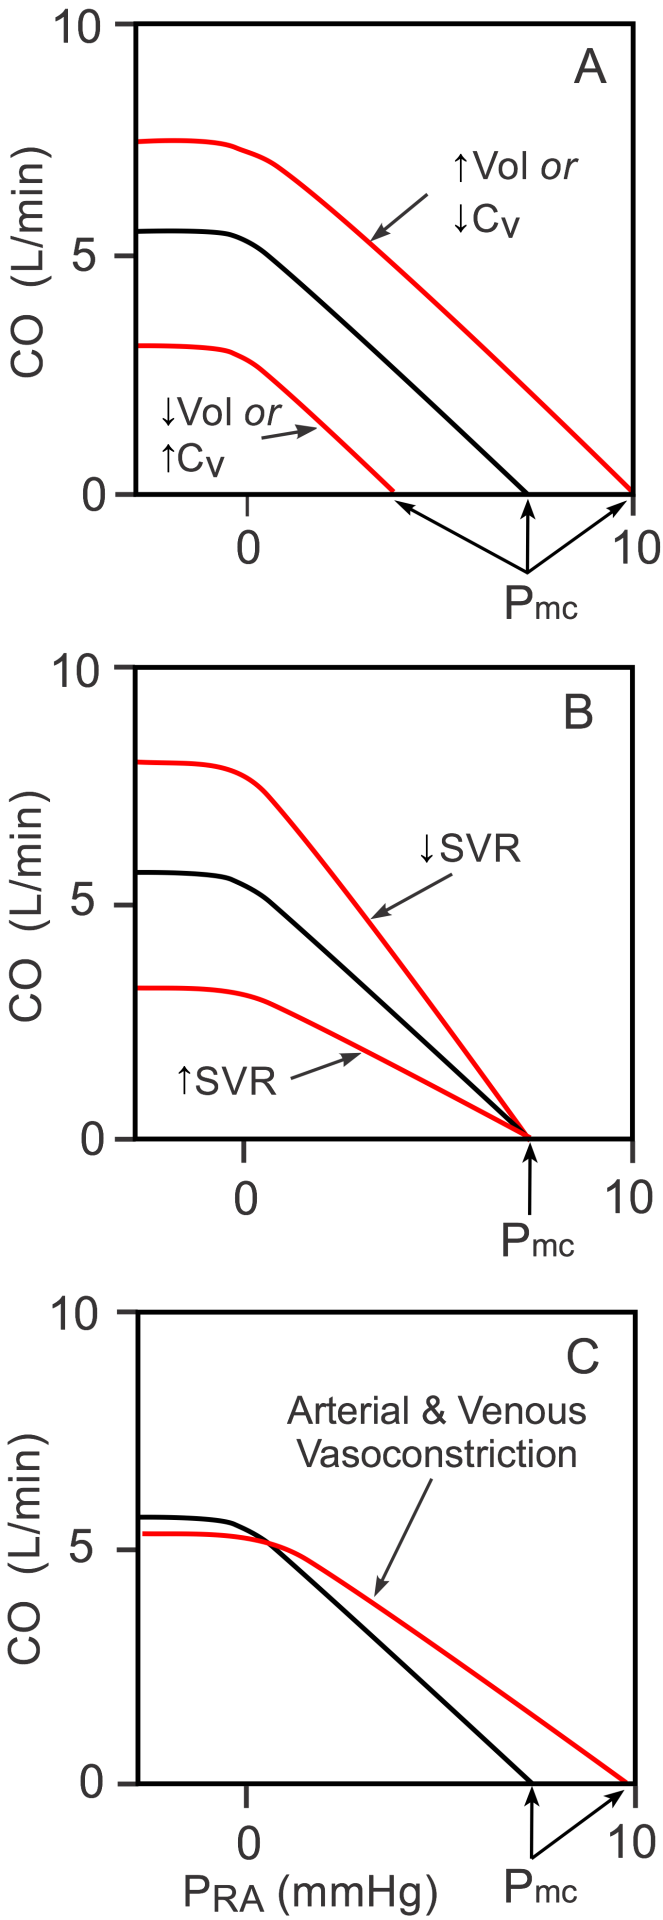 Systemic vascular function curves (sometimes called venous return curves) are generated by measuring changes in PRA (dependent variable) as CO (independent variable) changes (black curve in Panels A, B, and C). Note that the independent and dependent variables are reversed for these curves compared to the cardiac function curves described above. Experimentally, if cardiac output is stopped by fibrillating the heart and the baroreflex is blocked, aortic pressure falls and PRA increases to a common value of about 8 mmHg (x-intercept of the black curve in the figure). This pressure, which is recorded shortly after the heart is stopped, is called the mean circulatory filling pressure (Pmc). This pressure is not midway between the mean arterial pressure and the PRA because venous compliance is 10-20-times greater than arterial compliance; therefore, as the volume of blood decreases in the arterial vessels and increases in the venous vessels, the arterial pressure typically falls at least 10-fold more than the venous pressure rises. If the heart is restarted, then PRA decreases as the CO increases (moved upward and leftward on the black curve). As the PRA falls below zero, the increase in CO plateaus because the vena cava collapses, thus limiting venous return to the heart.
There is no single systemic vascular function curve. Instead, there is a family of curves that are determined by the blood volume (Vol), venous compliance (CV; inversely related to venous tone) and systemic vascular resistance (SVR; primarily small artery and arteriole resistance) (Panels A and B). If, for example, blood volume is increased because of renal retention of sodium and water, or venous compliance is decreased because of sympathetic activation of the veins (Panel A), there is a parallel shift to the right in the vascular function curve, which leads to an increase in the Pmc when the heart is stopped. The opposite shift occurs with decreased blood volume or increased venous compliance.
If SVR is increased (Panel B) by administering an arterial vasoconstrictor drug, the slope of the systemic vascular function curve decreases, but there is little or no change in the Pmc. The opposite occurs with a decrease in SVR. The Pmc does not change appreciably with arterial constriction or dilation because arterial diameter changes (resistance changes) produce only a small change in total vascular compliance, which is largely determined by the venous vessels. If both arteries and veins are constricted during sympathetic activation, then the curve will shift to the right as shown in Panel C (increased Pmc because of decreased CV) and the slope will decrease because of the increase in SVR.
Coupling of Cardiac and Vascular Function
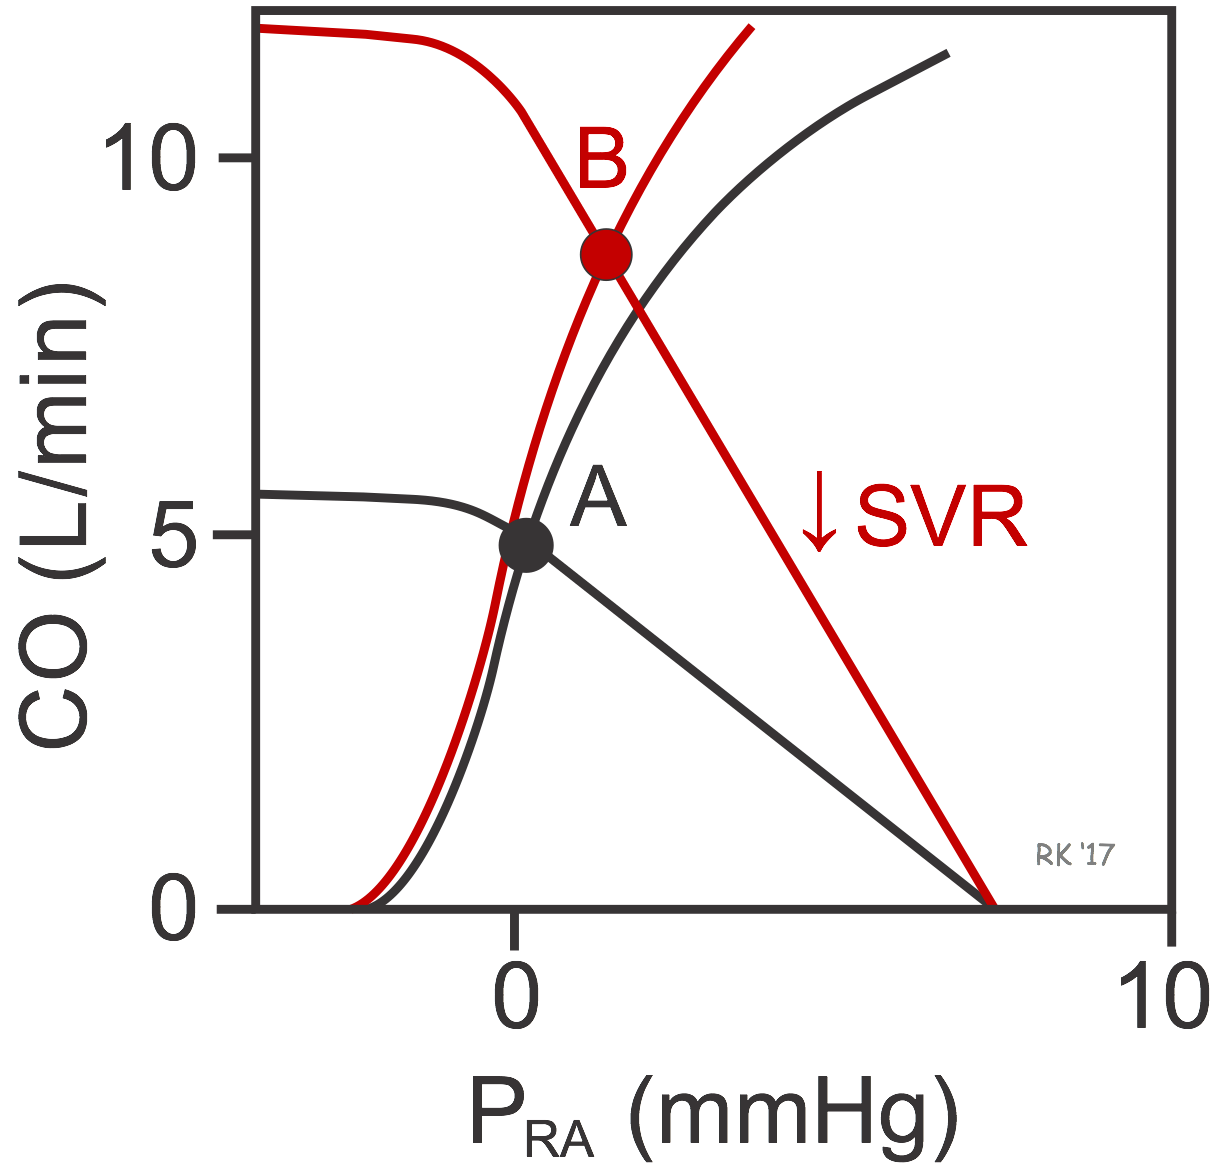 When the cardiac and vascular function curves are plotted together on the same graph coordinates, there is a unique intersection between the two curves (black curves at point A in figure). This crossing point of the two curves represents the steady-state operating point defining the cardiac output and right atrial pressure for the particular physiological conditions represented by the cardiac and vascular function curves. In this example, the CO is 5 L/min at a PRA of 0 mmHg (point A). If SVR were decreased by administering an arterial vasodilator drug, this would rotate the systemic function curve to the right (red curve) and Pmc would remain unchanged. The new equilibrium would be at point B, indicating that arterial dilation would lead to an increase in PRA and CO. The PRA increases because the decrease in SVR would decrease arterial pressure (and arterial blood volume), which shifts blood volume to the venous side. CO increases primarily because stroke volume is enhanced by the Frank-Starling mechanism in response to the increase in preload. The reduction in afterload produces a small shift to the left in the cardiac function curve.
If cardiac function were enhanced without a change in the systemic function curve (not shown), the cardiac function curve would shift up and to the left, along the vascular function curve (black curve). There would only be, however, only a small increase in CO because decreasing the PRA below zero causes venous collapse, which impedes venous return and hence filling of the ventricle. Therefore, large increases in cardiac output during cardiac stimulation require changes in systemic vascular function brought about by increased volume, decreased CV (venous constriction) or decreased SVR (arterial vasodilation).
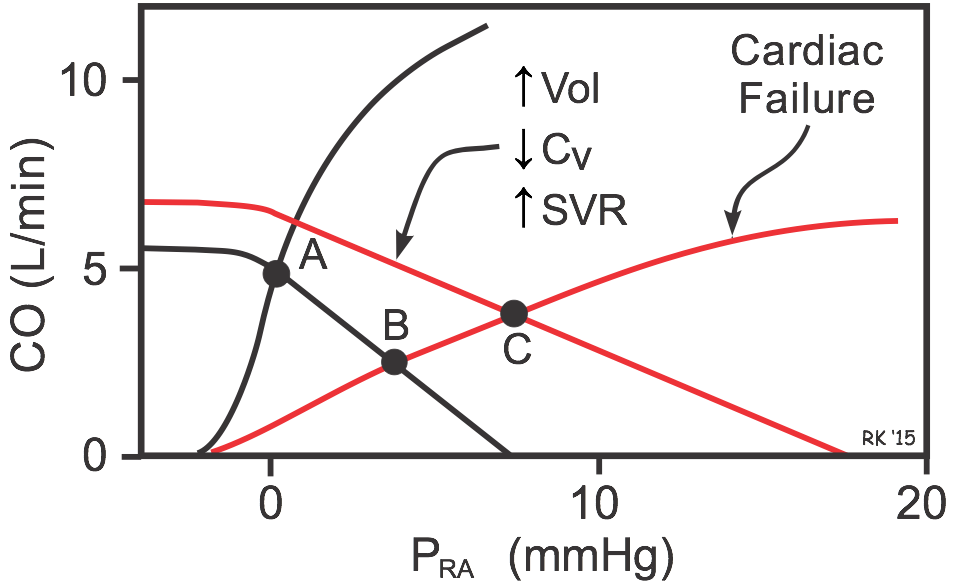 If cardiac function is depressed (e.g., as occurs in systolic heart failure), the cardiac function curve shifts down and to the right (red cardiac function curve in figure), and the intercept will change from Point A to B. This shows that depressing the heart leads to an increase in PRA and venous pressures along with the decrease in CO. If this depressed cardiac function is also accompanied by an increase in blood volume, venous constriction (decreased venous compliance, CV) and arterial constriction (increased SVR) as occurs in heart failure, the systemic function curve will shift to the right and have a reduced slope. The new operating point (C) represents this equilibrium condition. Notice that these systemic vascular function changes partially help to restore CO (from point B to C) despite the depressed cardiac function curve. This, however, occurs at the expense of further increasing PRA and venous pressures, which can lead to pulmonary and systemic edema.
Revised 11/04/2023