 Cardiovascular Physiology Concepts, 3rd edition textbook, Published by Wolters Kluwer (2021)
 Normal and Abnormal Blood Pressure, published by Richard E. Klabunde (2013)
Effects of Preload, Afterload and Inotropy on Ventricular Pressure-Volume Loops
Ventricular pressure-volume (PV) loops are an excellent tool for visualizing changes in ventricular function in response to changes in preload, afterload and inotropy. These ventricular changes can be complex because preload, afterload and inotropy are interdependent variables, meaning that when one variable is changed, the other variables change. Therefore, it is of first importance to understand the independent effects of each of these variables on ventricular function when the other variables are held constant. The next step is to see how changing one variable leads to changes in the other variables, as occurs in the body, which is described on another page. Please note that the independent changes depicted below do not illustrate what normally happens in the body in response to a change in preload, afterload or inotropy, but are observed in carefully controlled experimental studies. It is essential to first understand how preload, afterload, and inotropy independently alter ventricular pressure-volume relationships.
Independent Effects of Preload
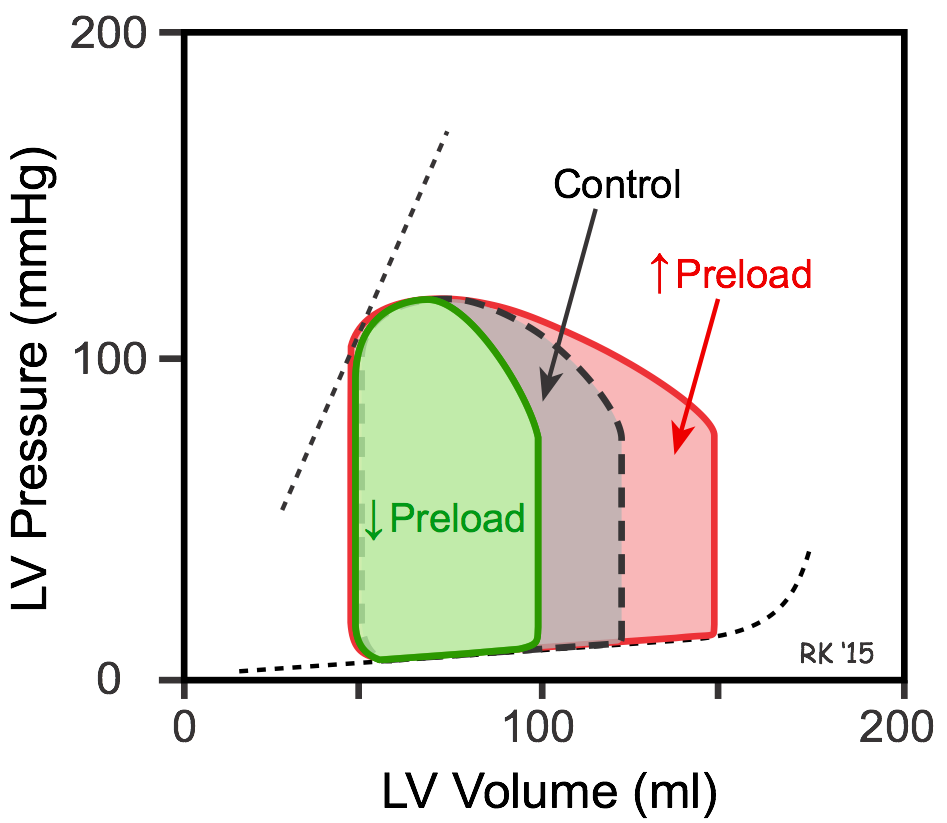 To examine the independent effects of preload, assume that aortic systolic and diastolic pressure (afterload), and inotropy are held constant. The left ventricle is filled with blood from the pulmonary veins. If pulmonary venous flow is increased, the ventricle will fill to a greater extent (end-diastolic volume is increased; red loop in figure). As the ventricle contracts, it will eject blood more rapidly because the Frank-Starling mechanism will be activated by the increased preload. With no change in afterload or inotropy, the ventricle will eject blood to the same end-systolic volume despite the increase in preload. The net effect will be an increase in stroke volume, shown by an increase in the width of the PV loop (100 compared to 75 ml in figure). The ejection fraction (EF) will increase slightly from 60 to 67%.
The ability to contract to the same end-systolic volume is a property of cardiac muscle that can be observed using isolated cardiac muscle and studying isotonic (shortening) contractions under the condition of constant afterload. When muscle preload length is increased, the contracting muscle shortens to the same minimal length as found before the preload was increased (see Effects of Preload on Cardiac Fiber Shortening).
If pulmonary venous flow is decreased, then the ventricle will fill to a smaller end-diastolic volume (decreased preload; green loop in figure). This will cause stroke volume to decrease (from 75 to 50 mL in figure) and EF to decrease from 60 to 50%, but the end-systolic volume will be unchanged.
To summarize, changes in preload alter the stroke volume; however, end-systolic volume is unchanged if afterload and inotropy are held constant. There is, however, a caveat to consider. If the concept of ventricular wall stress is used to define afterload instead of simply aortic pressure, then changes in preload volume produce a small change in ventricular wall stress and, therefore, afterload. Because of this, small changes in end-systolic volume are observed when end-diastolic volume is altered even if aortic pressure and inotropy are controlled. For example, increasing end-diastolic volume leads to a small increase in end-systolic volume because of increased wall stress (afterload) at end-diastole.
Independent Effects of Afterload
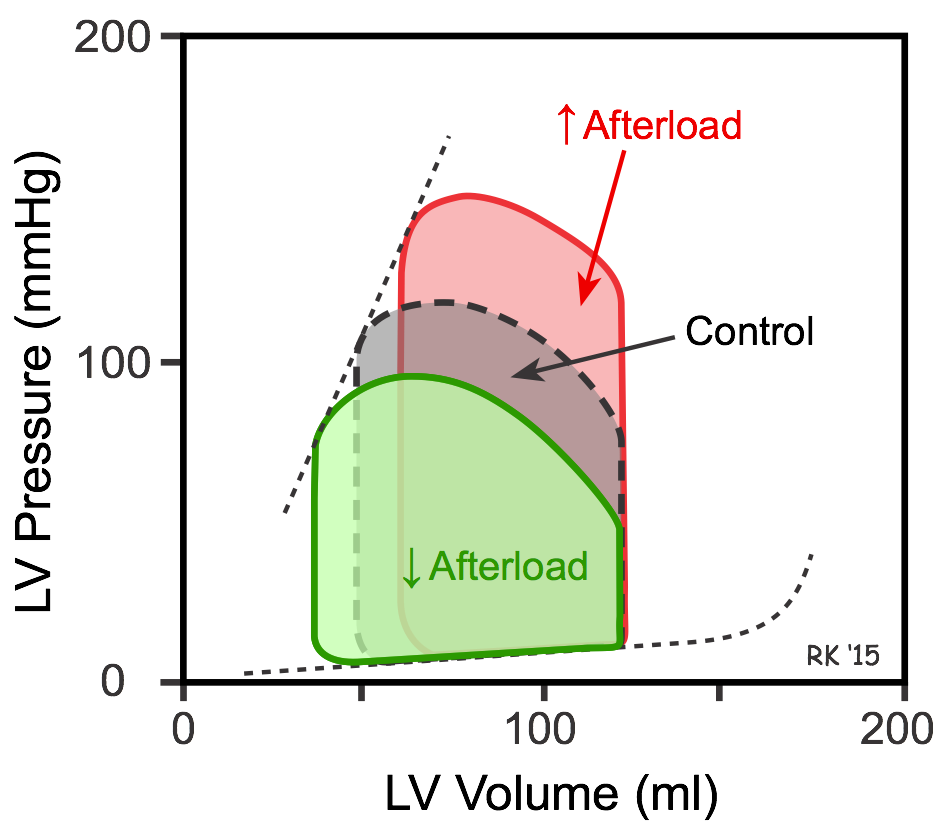 If afterload is increased by increasing aortic pressure, the isovolumetric contraction phase is prolonged because the ventricle needs to generate a higher pressure to overcome the elevated aortic diastolic pressure. Therefore, ejection begins at a higher aortic diastolic pressure. If preload (end-diastolic volume) and inotropy are held constant, this will cause a smaller stroke volume and an increase in end-systolic volume (red loop in figure). Stroke volume is reduced because increased afterload reduces the velocity of muscle fiber shortening and the velocity at which the blood is ejected (see force-velocity relationship). A reduced stroke volume at the same end-diastolic volume results in reduced ejection fraction. If afterload is reduced by decreasing aortic pressure, the opposite occurs – stroke volume and ejection fraction increase, and end-systolic volume decreases (green loop in figure).
Independent Effects of Inotropy
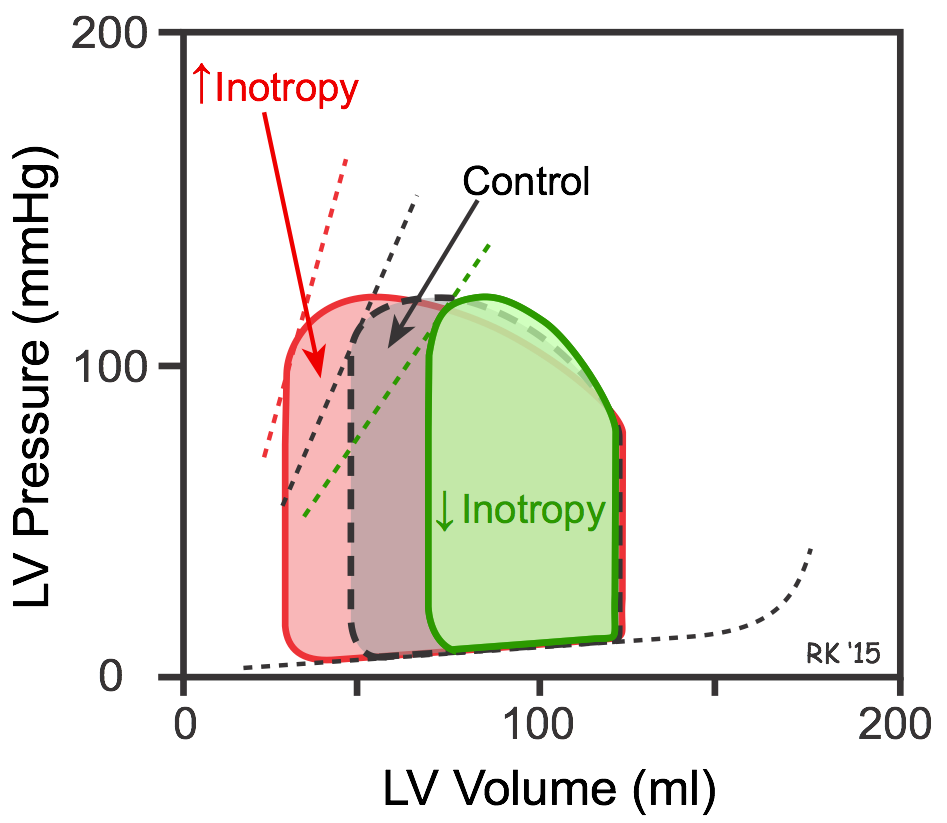 Increasing inotropy increases the velocity of muscle fiber shortening at a fixed preload and afterload (see force-velocity relationship). This enables the ventricle to increase the rate of pressure development and ejection velocity, which increases stroke volume and ejection fraction, and decreases end-systolic volume (red loop in figure). In PV loop diagrams, increased inotropy increases the slope of the end-systolic pressure-volume relationship (ESPVR; upper dashed lines in figure), which permits the ventricle to generate more pressure at a given LV volume. Decreasing inotropy has the opposite effects; namely, increased end-systolic volume and decreased stroke volume and ejection fraction (green loop in figure).
Interdependent Effects of Preload, Afterload and Inotropy
In the intact heart, preload, afterload and inotropy do not remain constant. To further complicate matters, changing any of these variables usually changes the other two variables. Therefore, the above PV loops, although they illustrate the independent effects of these three variables, do not represent what happens when the heart is in the body. However, if one understands the independent effects of these variables, then it is relatively easy to combine the loops to illustrate what occurs when multiple variables change. To learn more about these interactions, CLICK HERE.
Revised 11/04/2023