
 Cardiovascular Physiology Concepts, 3rd edition textbook, Published by Wolters Kluwer (2021)
 Normal and Abnormal Blood Pressure, published by Richard E. Klabunde (2013)
Ventricular Pressure-Volume Relationship
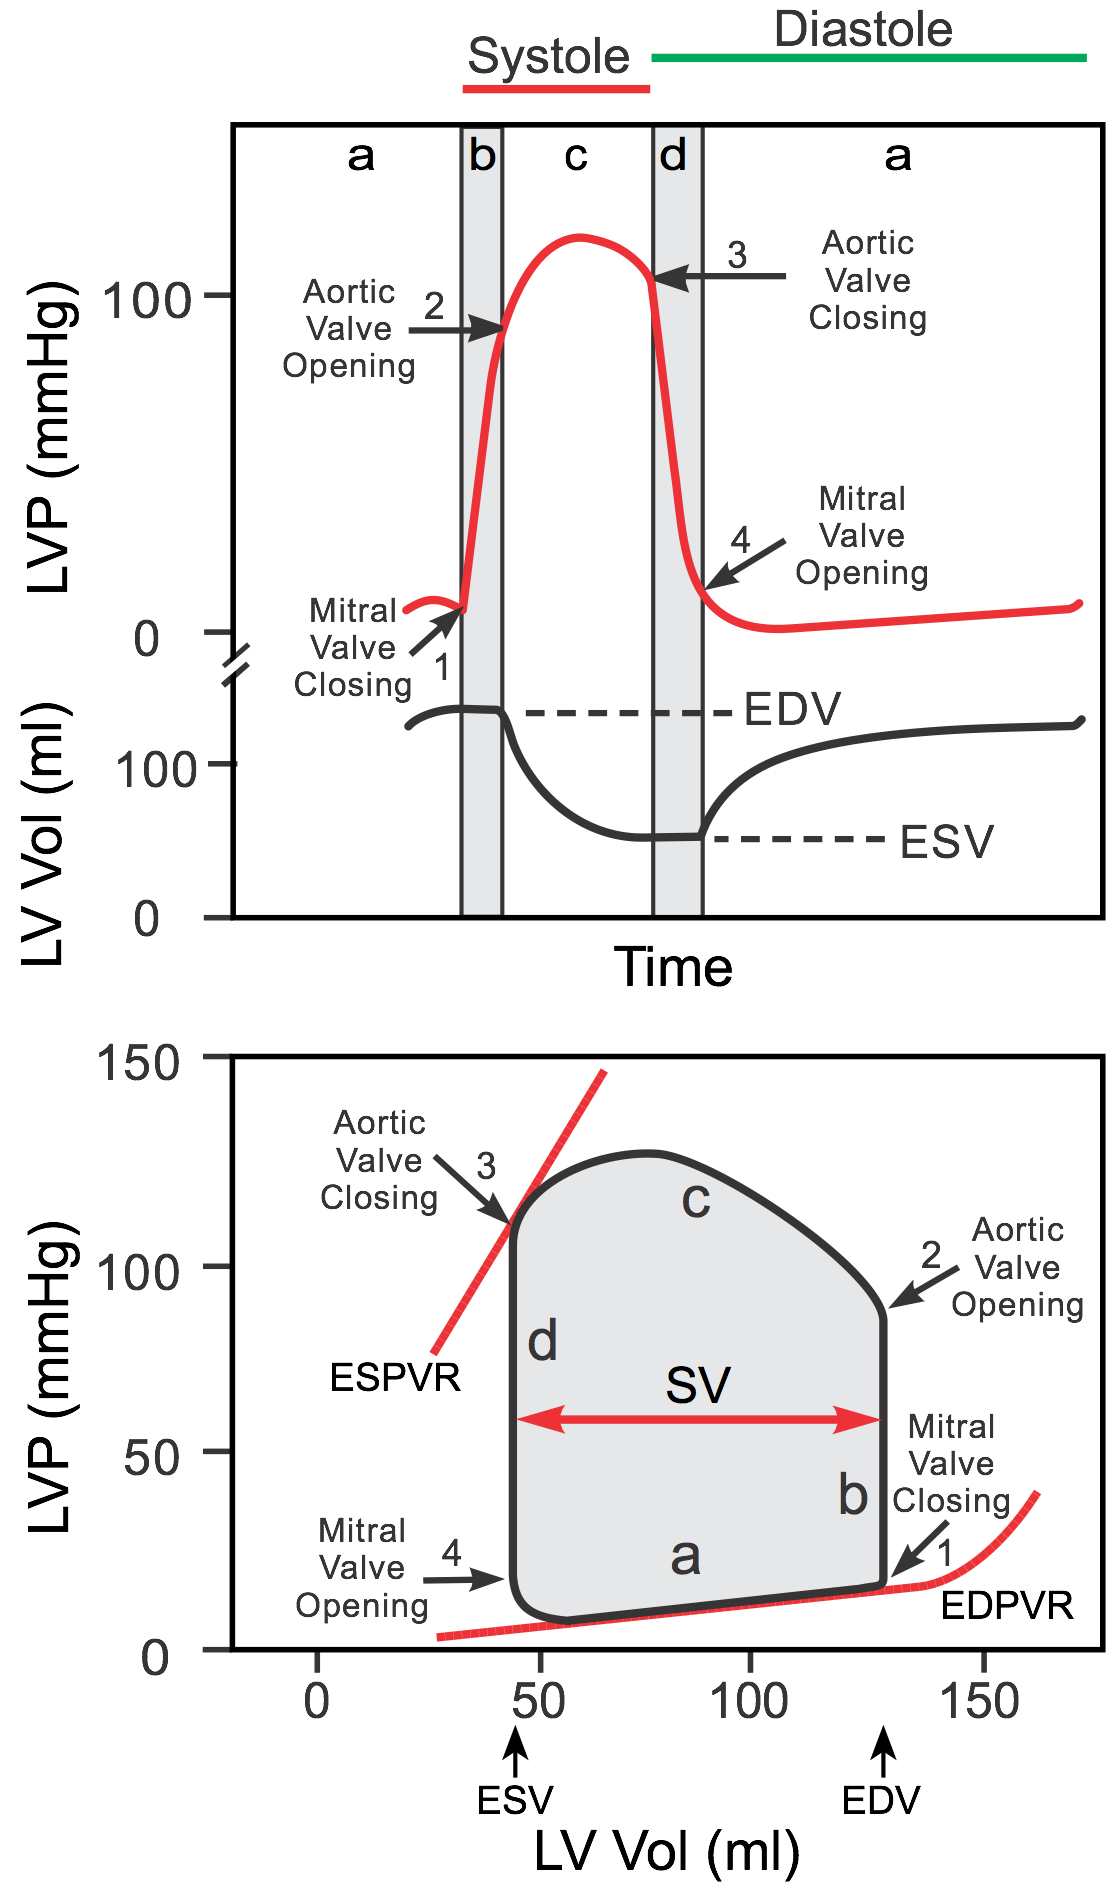 Left ventricular pressure-volume (PV) loops are derived from pressure and volume information found in the cardiac cycle diagram (upper panel of the figure). To generate a PV loop for the left ventricle, the left ventricular pressure (LVP) is plotted against the left ventricular volume (LV Vol) at multiple time points during a complete cardiac cycle. When this is done, a PV loop is generated (bottom panel of figure and linked YouTube video).
Ventricular filling occurs along the end-diastolic pressure-volume relationship (EDPVR), or passive filling curve for the ventricle. The slope of the EDPVR is the reciprocal of ventricular compliance. Therefore, changes in ventricular compliance alter the slope of the passive filling curve. For example, in ventricular hypertrophy the ventricle is less compliant (i.e., it is stiffer) and therefore the slope of the filling curve is increased. This results in higher pressures during filling at a given ventricular volume. Another example of how the EDPVR can be altered is when a ventricle chronically dilates (remodels) as occurs in dilated cardiomyopathy or in valve disease. A dilated ventricle has a higher passive compliance and therefore the slope of the filling curve is reduced. This results in lower ventricular pressures during filling at any given ventricular volume.
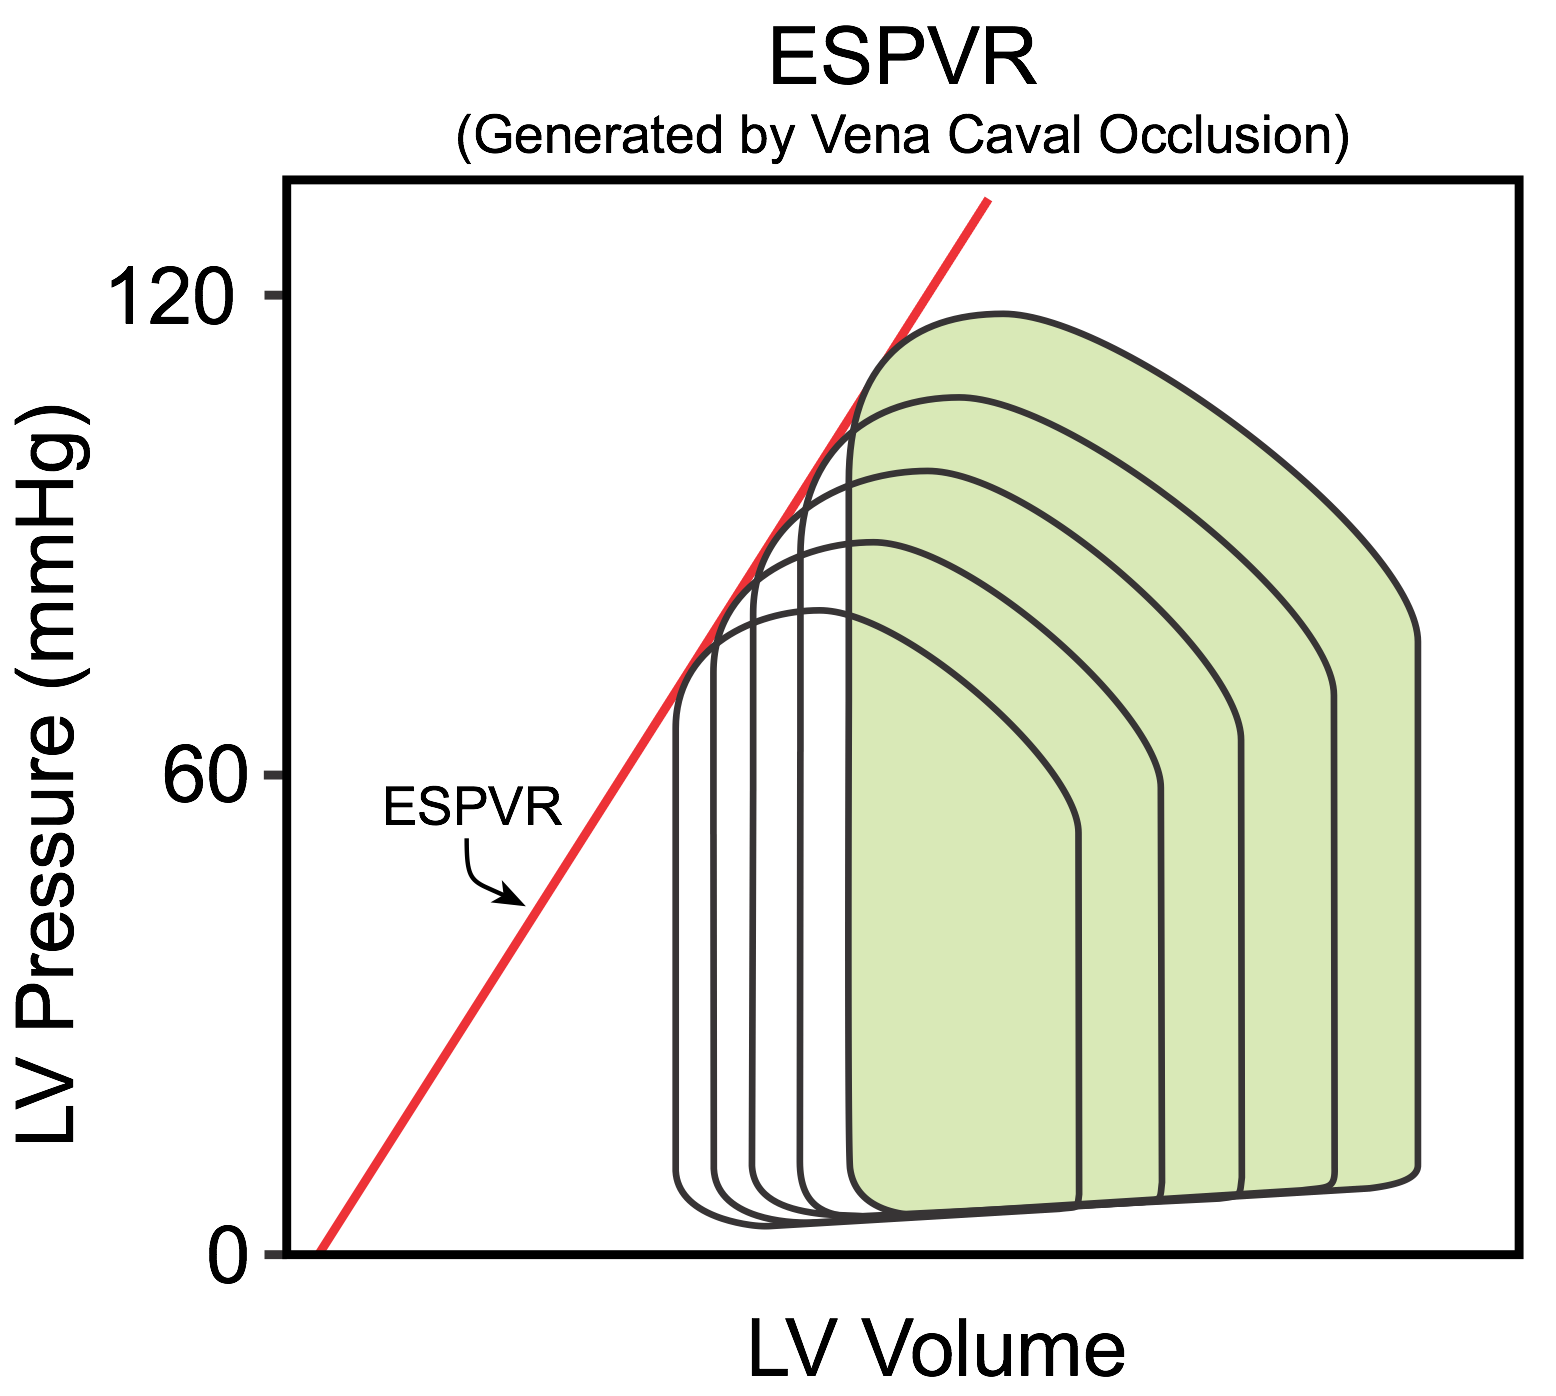 The maximal pressure that can be developed by the ventricle at any left ventricular volume is defined by the end-systolic pressure-volume relationship (ESPVR), which represents the inotropic state of the ventricle. The slope and x-intercept of the ESPVR is generated experimentally by occluding the inferior vena cava (IVC), which reduces venous return to the heart (see figure). This decreases ventricular preload (EDV) and causes the PV loop to shift to the left and get smaller over several heart beats; decreased preload reduces SV (loop width). Peak systolic pressure (loop height) also decreases because arterial pressure falls as the cardiac output declines during IVC occlusion. Therefore, afterload is decreased along with the preload. The ESPVR is determined by the line intersecting the upper left corners of the loops. A linear relationship occurs within a narrow range of pressures and volumes (several consecutive beats). After several seconds, the ESPVR becomes non-linear with a steeper slope as baroreflexes increase ventricular inotropy. It is important to note that the pressure-volume loop cannot cross over the ESPVR because that relationship defines the maximal pressure that can be generated at a specific inotropic state.
The end-diastolic and end-systolic pressure-volume relationships are analogous to the passive and total tension curves used to analyze isolated muscle function.
The PV loop will change as the preload, afterload and inotropic state of the heart change. To see how these affect PV loops, CLICK HERE.
Click below to see how the following conditions affect PV loops:
Mini-Lecture: Generation of Ventricular Pressure-Volume Loops (Time = 8.7 minutes)
Revised 11/04/2023