 Cardiovascular Physiology Concepts, 3rd edition textbook, Published by Wolters Kluwer (2021)
 Normal and Abnormal Blood Pressure, published by Richard E. Klabunde (2013)
Length-Tension Relationship for Cardiac Muscle (Effects of Preload)
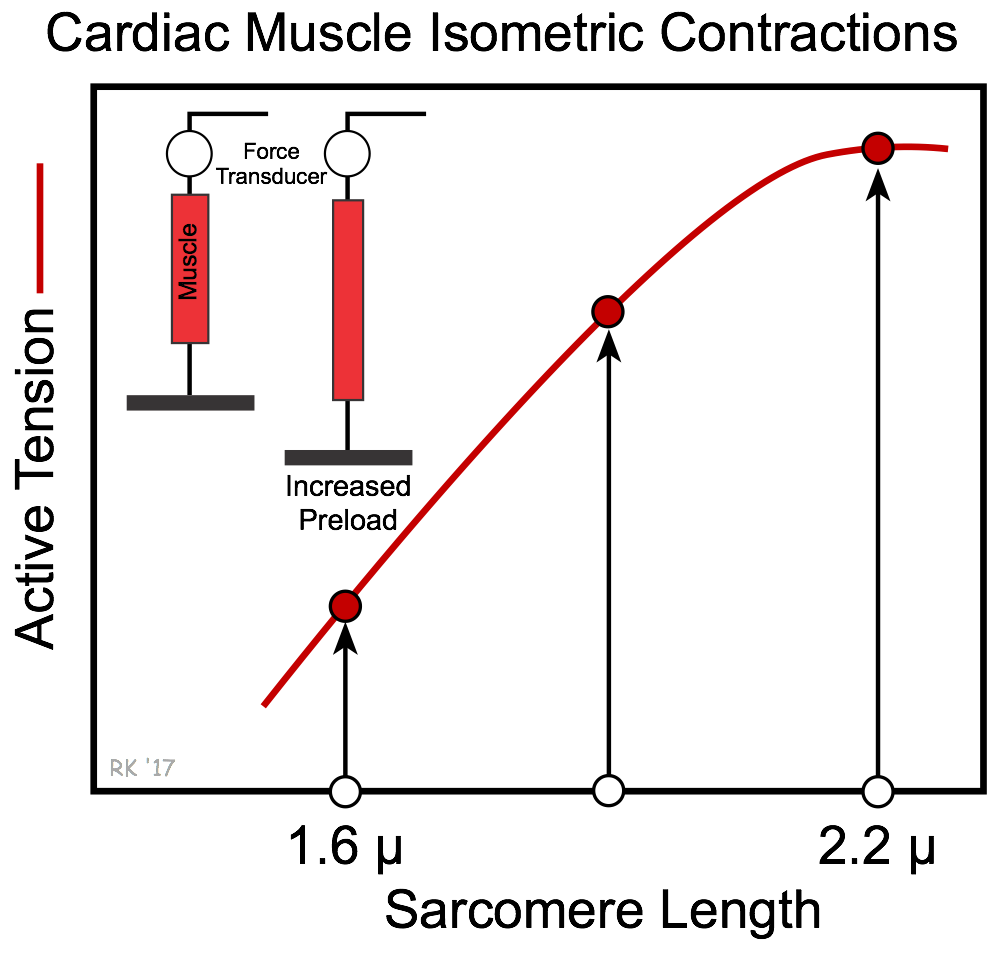 When the mechanical properties of isolated cardiac muscle are studied in the laboratory, we find that if the muscle is stimulated to contract at short resting sarcomere lengths (i.e., at low preloads) under isometric conditions (fixed length), the amount of active tension developed (total tension minus the resting tension) is relatively small. If the same experiment is repeated with the muscle at a longer preload length before contraction, the developed active tension is increased. If this experiment is done at several preload lengths, and active tension is plotted as a function of preload, we observe the relationship shown in the figure. This plot is called the length-tension diagram for isometric contractions. In summary, increases in preload lead to an increase in active tension. Not only is the magnitude of active tension increased, but also the rate of active tension development.
The changes in active tension caused by changes in preload are related to changes in the number of actin and myosin cross bridges formed, which depends on the sarcomere length. Changes in preload also affect active tension by altering the sensitivity of troponin C to calcium. This is referred to as length-dependent activation of the muscle fiber, and is the primary mechanism by which cardiac muscle alters its force of contraction in response to changes in preload.
The length-tension diagram shows that as preload increases, there is an increase in active tension up to a maximal limit. The maximal active tension corresponds in cardiac muscle to a sarcomere length of about 2.2 microns. Cardiac muscle, unlike skeletal muscle, does not display a descending limb on the active tension curved because the greater stiffness of cardiac muscle normally prevents its sarcomeres from being stretched beyond 2.2 microns.
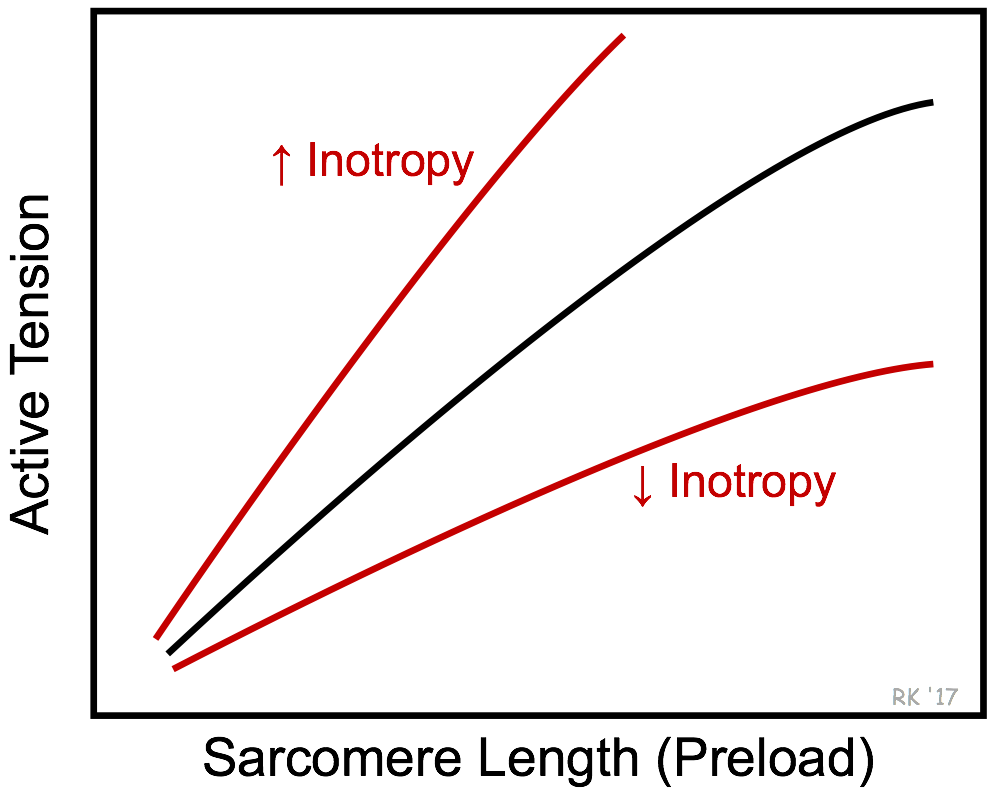 There is no single, unique active tension curve in the length-tension relationship in cardiac muscle. The slope and magnitude of the active tension curve at a particular preload depend upon the inotropic state of the muscle. If, for example, inotropy is increased by applying norepinephrine, the total tension curve shifts up and to the left, as shown in the figure. This results in an increase in active tension development at any preload length. The opposite occurs when the inotropic state is reduced. Therefore, the effects of preload on active tension development depend on the inotropic state of the contracting muscle.
A 5-minute recorded lecture on this topic can be viewed by clicking on Cardiac Length-Tension Relationship.
The above discussion describes how changes in preload (and inotropy) affect the force generated by cardiac muscle fibers during isometric contractions (i.e., with no change in length). Cardiac muscle fibers, however, also undergo shortening when they contract (i.e., isotonic contractions). Changes in preload also affect the magnitude of shortening and the velocity of fiber shortening.
Revised 01/23/2023